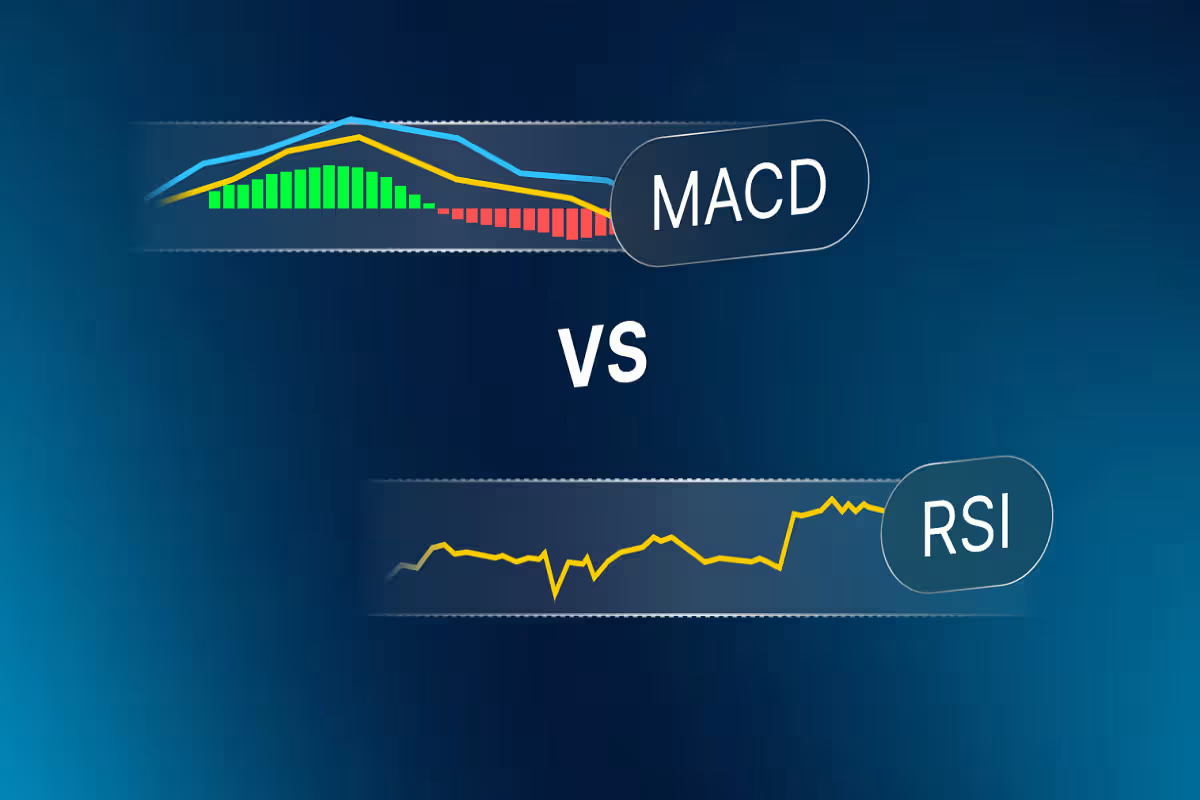
Introduction: Deciphering Momentum Exhaustion in Foreign Exchange Markets
In the complex arena of foreign exchange trading, retail participants frequently struggle because they rely on lagging technical indicators in isolation. A classic textbook mistake involves treating oscillators like the Relative Strength Index (RSI) or the Moving Average Convergence Divergence (MACD) as simple overbought and oversold triggers. Novice traders often assume that whenever the RSI crosses above the 70 threshold, the currency pair is automatically "overpriced" and must be sold short. Similarly, they believe a reading below 30 signals an immediate buying opportunity. In institutional reality, strong currency trends can remain overbought or oversold for extended periods during high-momentum macroeconomic expansions.
To consistently catch high-probability market reversals, professional currency analysts look beyond standard indicator settings and focus on divergence—a powerful mathematical discrepancy between price action and momentum oscillator readings. Divergence occurs when the price of a currency pair records a new extreme (such as a higher high or a lower low), but the corresponding momentum indicator fails to confirm that movement, registering a lower high or a higher low instead. This fundamental misalignment signals that institutional buying or selling pressure is quietly exhausting itself. This comprehensive manual explores the mechanics of regular and hidden divergences using RSI and MACD, showing you how to integrate these momentum tools with institutional market structure for precise, high-reward execution.
1. The Core Mechanics: Understanding Momentum Versus Price Action
To master divergence trading, you must first understand the fundamental relationship between price and momentum. Price represents the ultimate consensus of buyers and sellers at any given second, recorded as numerical exchange rates. Momentum, on the other hand, measures the velocity and rate of change behind those price movements. Think of price as a car traveling down a highway, and momentum as the pressure applied to the gas pedal.
When price pushes to a new high and the RSI or MACD histogram simultaneously records a higher peak, momentum fully confirms the price move. Institutional volume is backing the expansion, indicating that the trend has substantial fuel remaining.
When price prints a higher high, but the oscillator records a lower high, momentum is contracting. Fewer institutional orders are supporting the latest price extension, signaling that a major trend reversal or deep structural correction is approaching.
Recognizing this discrepancy gives currency traders a unique analytical edge. While retail market participants chase breakout candles at market extremes, professional desks identify divergence as an early warning signal of institutional position unwinding.
Reference Blueprint: Retail Overbought/Oversold vs. Institutional Divergence
fxone.online research labThe matrix below contrasts flawed retail indicator habits against professional institutional divergence tracking frameworks.
2. Regular Bullish and Bearish Divergences: RSI & MACD Deep Dive
Regular divergences are the primary tools used by technical traders to spot trend reversals. Depending on market direction, they manifest in two distinct configurations:
-
Regular Bullish Divergence (Catching Bottoms): Occurs in a downtrend when price records a Lower Low (LL), but the RSI or MACD indicator prints a Higher Low (HL). This reveals that despite the new price low, downward selling pressure is drying up, often preceding a sharp bullish reversal.
-
Regular Bearish Divergence (Catching Tops): Occurs in an uptrend when price records a Higher High (HH), but the indicator prints a Lower High (LH). This highlights fading institutional buying interest, warning that a bearish reversal or major correction is imminent.
-
MACD Histogram Dynamics: While the MACD signal line crossover is useful, professional desks monitor the MACD histogram bars. Divergences in the histogram peaks provide much faster alerts of momentum shifts than standard moving average crossovers.
To maximize reliability, traders should look for divergences that form at key institutional reference points, such as higher-timeframe order blocks, fair value gaps, or major liquidity pools.
Visual Masterclass: Spotting RSI and MACD Divergences in Live Forex Sessions
Watch this detailed visual walkthrough breaking down how institutional desks identify high-probability reversal setups using momentum divergence across major currency pairs.
3. Hidden Divergences: Riding Existing Trends with Institutional Momentum
While regular divergences are utilized for catching reversals, hidden divergences serve an entirely different purpose: identifying trend continuation points. Many retail traders incorrectly attempt to fade every divergence they see, leading to heavy losses when trading against strong macro trends.
Hidden divergences occur during healthy pullbacks within an established trend:
-
Hidden Bullish Divergence: In an ongoing uptrend, price records a Higher Low (HL), but the RSI or MACD oscillator prints a Lower Low (LL). This indicates that despite the corrective pullback, internal momentum is stronger than during the previous low, signaling that the primary bullish trend is ready to resume.
-
Hidden Bearish Divergence: In a prevailing downtrend, price records a Lower High (LH), but the oscillator prints a Higher High (HH). This reveals that corrective rallies are losing energy, confirming that institutional sellers are stepping back in to drive the currency pair lower.
Mastering hidden divergences ensures you never mistakenly trade against strong institutional trends, allowing you to scale into winning positions with confidence.
Comparative Analysis: Regular vs. Hidden Divergence Framework
Review the structural differences between regular reversal divergences and hidden continuation divergences.
| Divergence Type | Price Action Behavior | Oscillator Action (RSI/MACD) | Strategic Application |
|---|---|---|---|
| Regular Bullish | Lower Low (LL) | Higher Low (HL) | Catching market bottoms and bullish reversals |
| Regular Bearish | Higher High (HH) | Lower High (LH) | Catching market tops and bearish reversals |
| Hidden Bullish | Higher Low (HL) | Lower Low (LL) | Riding continuation pullbacks in bull trends |
| Hidden Bearish | Lower High (LH) | Higher High (HH) | Riding continuation rallies in bear trends |
During active London session operations at fxone.online, our research desk analyzed EUR/USD approaching a key 4-hour resistance zone at 1.0950. Price pushed aggressively upward, printing a fresh Higher High (HH) at 1.0975. However, our multi-indicator setup flagged a stark regular bearish divergence: the RSI and MACD histogram both printed clear Lower Highs (LH) relative to the prior swing peak. Rather than executing short positions blindly on the indicator crossover, our desk waited for a 15-minute Change of Character (CHoCH) break beneath internal support. Once confirmed, we executed short positions with a 20-pip stop-loss, successfully capturing an 85-pip downward impulse move as institutional distribution took hold.
4. Risk Management, False Divergences, and Execution Synergy
While divergence is a potent analytical tool, it should never be traded in isolation. In strong trending markets, oscillators can display multiple premature divergences before an actual reversal occurs. To protect your capital and eliminate false signals, apply these four core rules:
-
Require Structural Confirmation: Always pair a divergence signal with a market structure shift, such as a Change of Character (CHoCH) or a break of a key internal swing level. Never enter solely because an oscillator printed a divergence.
-
Higher Timeframe Context: Ensure your divergence setup aligns with higher-timeframe zones (Daily or 4-hour order blocks). Divergences forming in the middle of a consolidation range carry a very low probability of success.
-
Robust Stop-Loss Placement: Position your protective stop-loss safely beyond the extreme wick of the swing point where the divergence formed, rather than placing it arbitrarily close to current price action.
-
Strict Position Sizing (1% Rule): Cap your maximum financial risk per trade at 1% or less of total account equity, ensuring mathematical survival through temporary losing streaks.
Frequently Asked Questions
Which indicator is better for divergence trading: RSI or MACD?
Neither is universally superior; they serve complementary functions. RSI is exceptional for identifying precise overextended momentum extremes, while MACD histogram divergences excel at capturing shifts in institutional buying and selling pressure. Many professional traders use both in conjunction.
Why do divergences fail in strong currency trends?
During strong macroeconomic trends driven by central bank interest rate differentials, momentum oscillators can remain in overbought or oversold territory for extended periods. Trading regular divergences against a strong macro trend without structural confirmation often leads to false breakouts.
Summary: Mastering Divergence Trading with Institutional Precision
Integrating divergence trading with RSI and MACD transforms your technical analysis from guessing overbought levels to tracking real-time institutional momentum exhaustion. By combining regular and hidden divergences with multi-timeframe market structure shifts and strict risk parameters, you can catch major market reversals and ride trend continuations with high-probability precision.
About the Author: FX Research Team, fxone.online
The FX Research Team at fxone.online comprises institutional market analysts, macroeconomic forecasters, and veteran currency traders dedicated to elevating educational standards in retail foreign exchange. Our curriculum cuts through noise, focusing entirely on fundamental catalysts, risk metrics, and structural price mechanics.