Introduction: Moving Beyond Arbitrary Lines – The Institutional Reality of Market Levels
In the study of retail foreign exchange technical analysis, almost every beginner starts with a fundamental premise: drawing horizontal lines across historical price peaks and valleys. Textbooks and basic trading courses instruct participants to connect two or more swing highs to establish resistance, or connect swing lows to create support. While this conceptual foundation introduces the general idea of supply and demand balancing zones, relying exclusively on simple, static lines often leads to repeated trading frustrations. Algorithms operated by multinational banks, hedge funds, and primary dealers routinely slice directly through obvious retail support levels, triggering stop-loss clusters before reversing violently in the intended direction.
To transition from a struggling retail participant to a disciplined, consistent currency trader, you must redefine how you view horizontal and dynamic structural barriers. Market levels are not mere lines on a computer screen; they represent zones of intense liquidity, institutional order placement, and pending execution interest. This comprehensive manual explores the structural mechanics of support, resistance, and key market levels from an institutional perspective, teaching you how to differentiate high-probability structural barriers from retail traps, harness multi-timeframe confluences, and integrate these levels into your daily execution strategy.
1. The Psychology and Mechanics of Horizontal Support and Resistance
At its core, support represents a price floor where aggregate buying pressure overcomes selling pressure, halting a downward decline and causing price to bounce upward. Conversely, resistance acts as a price ceiling where selling pressure overwhelms buying interest, stopping an advance and forcing price lower. However, these zones do not function because of mystical chart geometry; they function because of human memory, institutional positioning limits, and resting orders.
Real support is formed where large financial institutions previously accumulated heavy long positions. When price returns to these zones, institutions act to protect their break-even thresholds or add to existing positions, creating strong defensive buying waves.
Resistance represents areas where smart money initiated large short allocations or where heavy distribution occurred. When price revisits these structural ceilings, resting institutional limit orders activate to cap further upside expansion.
Furthermore, market memory plays a vital psychological role. When a major resistance level is decisively broken with strong institutional momentum, market participants who missed the initial move view the broken ceiling as a future value zone. Consequently, old resistance frequently transforms into new support (often referred to as polarity shift). Understanding this behavioral flip helps traders avoid chasing momentum and instead wait for high-probability retest entries.
Reference Blueprint: Retail S/R vs. Institutional Zone Mapping
fxone.online research labBelow is a structural contrast detailing how retail traders misinterpret market boundaries compared to how institutional algorithms track liquidity and execution zones.
2. Expanding Beyond Horizontals: Dynamic Levels, Session Highs/Lows, and Round Numbers
Relying strictly on static horizontal support and resistance limits your analytical scope. Professional currency traders incorporate multiple categories of key market levels to build a comprehensive trading bias across foreign exchange sessions.
The three core auxiliary level types monitored by institutional desks include:
-
Session Highs and Lows: The Asian, London, and New York trading sessions establish critical boundaries. Asian session ranges often act as accumulation zones, where liquidity builds up above session highs and below session lows before London or New York algorithms initiate directional expansion.
-
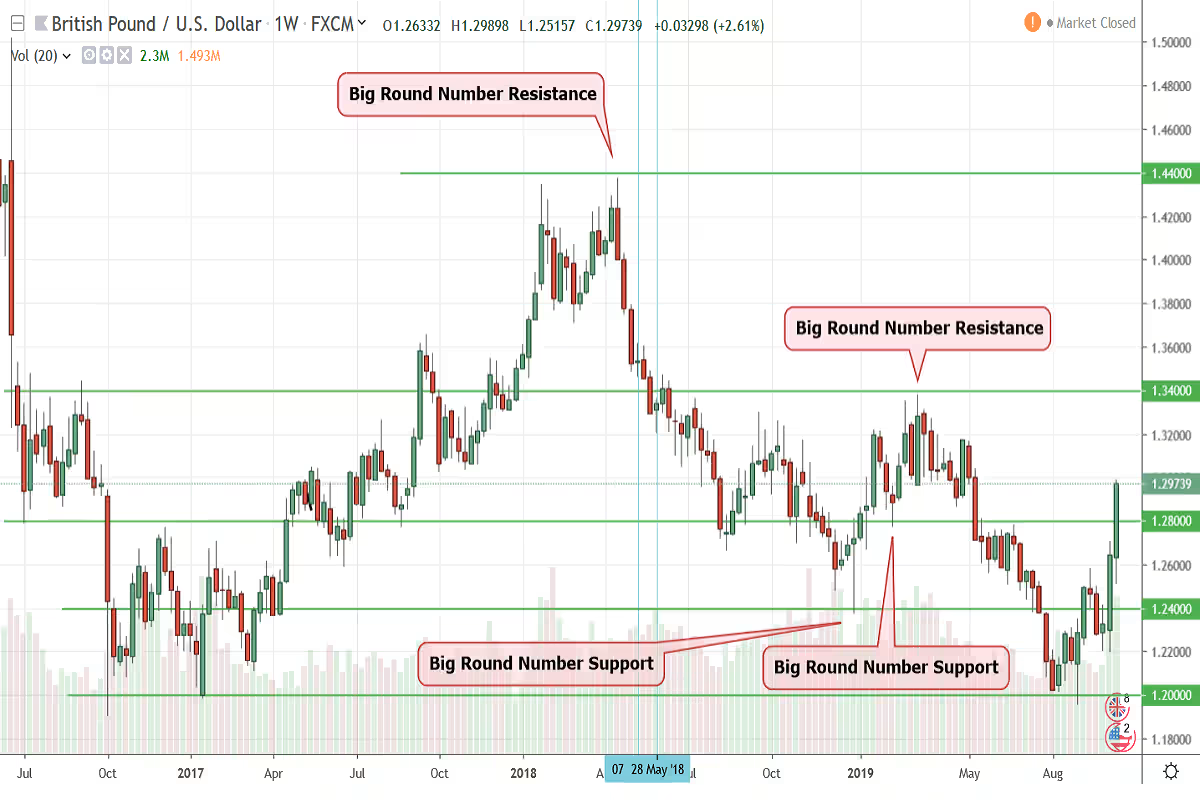
Psychological Round Numbers (Whole Handles): In major currency pairs like EUR/USD or GBP/USD, round institutional figures such as 1.0800, 1.0900, or 1.3000 act as natural magnets. Corporate hedgers, option barrier writers, and central bank intervention desks place heavy order volume at these exact psychological price markers.
-
Moving Average Confluence: While moving averages are lagging, major institutional algorithms track standard benchmarks like the 50-period and 200-period exponential moving averages (EMA) on 4-hour and Daily charts as dynamic support and resistance templates.
When a psychological round number aligns perfectly with a higher-timeframe horizontal support zone and a session low, it forms a high-confluence institutional pivot point where market reactions are remarkably reliable.
Visual Masterclass: Trading Key Market Levels Across Global Forex Sessions
Watch this intensive visual masterclass breaking down how institutional algorithms exploit session highs, round number handles, and support-resistance flips during London and New York overlaps.
3. The Intersection of Key Levels with Liquidity Pools and Stop Hunts
One of the most vital insights in modern currency trading is understanding the intimate relationship between support/resistance levels and liquidity pools. Retail trading education teaches millions of participants to place their stop-loss orders directly beneath clear support levels or directly above obvious resistance ceilings.
Institutional market makers and high-frequency algorithms are fully aware of where these retail stop-loss orders congregate. Because large institutional entities need enormous liquidity to fill multi-lot buy or sell orders without causing severe price slippage, they frequently engineer a temporary breakout past a key support or resistance level. This artificial price push—known as a stop hunt or liquidity sweep—triggers resting retail stop orders (which function as market orders in reverse).
Once the stop orders are absorbed and institutional inventory is fully filled, price snaps back inside the original trading range and races toward the opposing objective. Recognizing that key market levels act as liquidity magnets rather than impenetrable brick walls completely alters your trading mindset: instead of trading immediate breakouts, smart money traders wait for the liquidity sweep at key levels before executing counter-move entries.
Comparative Analysis: Traditional S/R vs. Institutional Level Framework
Examine how traditional retail support and resistance models contrast against institutional multi-factor key market level frameworks.
| Evaluation Parameter | Traditional Retail Support / Resistance | Institutional Key Market Level Framework |
|---|---|---|
| Level Definition | Hair-thin lines connecting previous swing peaks | Broad zones backed by unmitigated order blocks & volume |
| Breakout Handling | Assumes breakout signals continuation | Anticipates liquidity sweeps and false breakout traps |
| Stop-Loss Placement | Placed right behind obvious level extremes | Positioned safely outside engineered liquidity raid zones |
| Confluence Factors | Ignores sessions and macro round numbers | Integrates session highs/lows, handles, and order flow |
During active London session operations at fxone.online, our research desk analyzed a classic institutional setup on EUR/USD surrounding the key psychological handle of 1.0850 and the previous Asian session low. Retail participants had built heavy long positions above 1.0850, placing protective stops just beneath the Asian low at 1.0838. At 08:00 GMT, institutional algorithms drove a sharp 18-pip drop that pierced the 1.0838 level, sweeping retail stop orders and filling massive institutional long accumulation limits. Within 45 minutes, price violently reversed upward, rallying over 85 pips as the primary daily trend resumed. Traders utilizing the institutional key level framework identified this liquidity sweep as a prime buying opportunity rather than a bearish breakdown.
4. Risk Management, False Breakouts, and Trap Avoidance at Major Levels
Trading key market levels successfully requires ironclad risk management protocols. Because major levels attract intense volatility, entering positions blindly without confirmation can result in rapid drawdowns. To protect your capital and maximize expectancy, adhere to these four core risk rules:
-
Wait for Confirmation Candles: Never enter a trade the exact second price touches a support or resistance level. Wait for confirmation candlestick patterns (such as a pin bar, engulfing candle, or market structure shift) to validate the reaction.
-
Account for Spread and Slippage: Major currency pairs experience temporary spread widening during news releases and session openings. Ensure your limit entry and stop-loss buffers account for potential spread expansion.
-
Protect Against Stop Hunts: Place your protective stop-loss orders safely beyond the structural wick extreme or liquidity pool boundary rather than tightly hugging the support line.
-
Strict Position Sizing (1% Rule): Limit your maximum financial risk per trade to 1% or less of total account equity, ensuring absolute resilience through inevitable losing sequences.
Frequently Asked Questions
How many times can a support or resistance level be tested?
Generally, the more times a static horizontal level is tested by retail traders, the weaker it becomes. Each test exhausts existing resting orders and increases the likelihood that accumulated stop losses will be swept by institutional algorithms.
Why do currency prices often reverse right at round numbers?
Round numbers (like 1.1000 or 150.00) serve as psychological anchors for human traders, corporate hedgers, and option market makers. Large institutional barrier options and pending institutional limit orders are frequently concentrated at these exact figures.
Summary: Mastering Key Market Levels with Institutional Precision
Mastering support, resistance, and key market levels transforms your analytical perspective from a retail guesser to an institutional tactician. By recognizing that major price barriers function as liquidity pools and order execution zones rather than simple static lines, you can successfully navigate false breakouts, avoid stop hunts, and align your trade executions with smart money order flow.
About the Author: FX Research Team, fxone.online
The FX Research Team at fxone.online comprises institutional market analysts, macroeconomic forecasters, and veteran currency traders dedicated to elevating educational standards in retail foreign exchange. Our curriculum cuts through noise, focusing entirely on fundamental catalysts, risk metrics, and structural price mechanics.